What Happens If You Invest $100 a Month? 98 Years of Real Data
If you invest $100 a month in an S&P 500 index fund and keep going, history says you’ll probably end up well ahead, but not by the amount the calculators promise, and not in a straight line. Starting in January 2000, $100 a month grew to about $112,000 by the end of 2025 in today’s money, on $31,200 put in. For the first ten years, though, it was behind. A savings account was winning.
That second part is the bit nobody puts in the chart.
Search “invest $100 a month” and you’ll find the same calculation on page after page: a steady 10% a year, a smooth curve, and roughly half a million dollars after 40 years. I wanted to know what a real person would have seen along the way. So I made a video where my cartoon character Epi tries it, and I ran the numbers against every year of market history since 1928.
This post goes further than the video. You get the year-by-year numbers, the full table for every start year, and the part I left out because it didn’t fit in six minutes: what it actually felt like when I did this with my own money.
The setup: two people, same $100
Meet Epi and Benji. Both 25, same job, same rent, and both have $100 left over every month.
Benji reads the terms and conditions for fun and thinks the stock market is a casino. His $100 goes into a savings account. Epi’s goes into an S&P 500 index fund, which is one fund that holds the 500 biggest US companies.
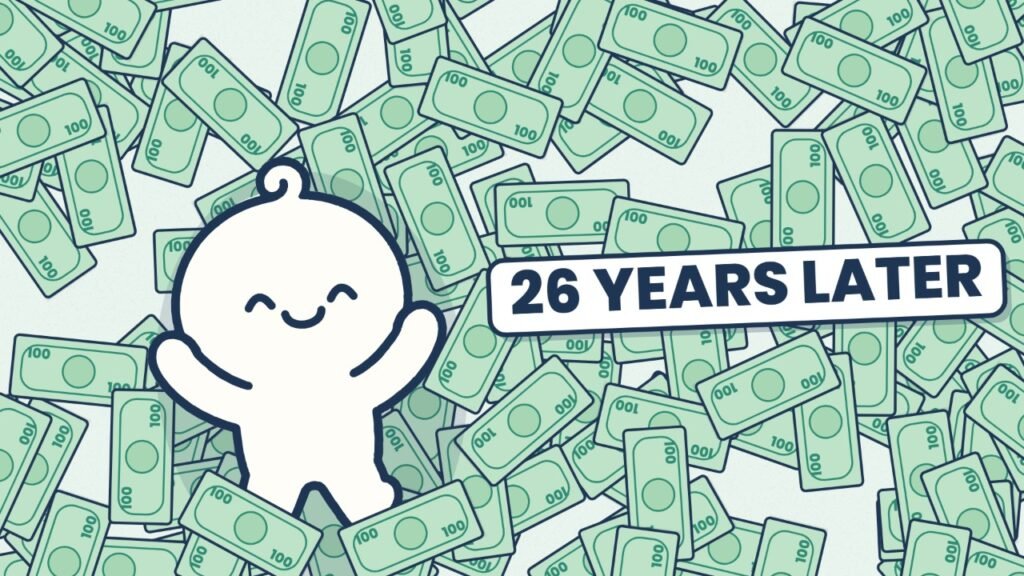
Nobody can show you the future, so we borrowed the past. Their next 26 years go exactly the way the market went starting January 2000. That start date isn’t random: it’s one of the hardest tests there is, because it sits right before two crashes (the dot-com bust and 2008).
A few ground rules, so you can check my work:
- $100 goes in at the start of every month.
- Epi’s money earns the S&P 500’s yearly return with dividends reinvested. Benji’s earns 3-month Treasury bill rates, which is roughly what a high-yield savings account pays.
- Every number is in today’s money. Each year’s return is reduced by that year’s inflation, so rising prices are already taken out.
The returns come from Aswath Damodaran’s historical data at NYU Stern, and inflation from the BLS consumer price index. Each year’s return is spread evenly across its months, so treat the results as close estimates, not to-the-dollar figures.
What happens if you invest $100 a month for 26 years
Here’s the race, year by year.
| Year | Put in | Epi (index fund) | Benji (savings) | Who’s ahead |
|---|---|---|---|---|
| 1 | $1,200 | $1,120 | $1,216 | Benji |
| 3 | $3,600 | $2,630 | $3,630 | Benji, by $1,000 |
| 5 | $6,000 | $6,275 | $5,908 | Epi |
| 8 | $9,600 | $11,229 | $9,700 | Epi, by $1,460 |
| 9 | $10,800 | $7,792 | $10,728 | Benji |
| 10 | $12,000 | $11,219 | $11,990 | Benji |
| 15 | $18,000 | $29,474 | $16,500 | Epi |
| 20 | $24,000 | $55,487 | $22,000 | Epi |
| 26 | $31,200 | $111,858 | $28,102 | Epi, by about $84,000 |
The lead swaps back and forth for a decade. Look at years 3 and 10 especially.
Years 1 to 3: the account goes the wrong way
Three years in, Epi has put in $3,600 and his account says $2,630. That’s a thousand dollars gone, on a plan that’s supposed to be the “safe, boring” one. Benji, meanwhile, is sending screenshots.
If you check your balance every morning (and when you’re new, you do), this is a bad way to start the day. It’s also completely normal. Since 1928, about one year in four has ended negative for the S&P 500.
Year 9: the crash
Year 9 replays 2008. In one year the market loses more than a third of its value, and Epi’s $11,229 drops to $7,792. Benji’s savings don’t even notice.
After a full decade, Epi has put in $12,000 and has $11,219. He’s still $781 short of what he deposited. The guy with the piggy bank is winning.
This is the point where most people quit. I’d have understood it.
The part that turns it around: crashes are a sale
Here’s what changes the whole picture. When Epi started, the S&P 500 stood at about 1,469 (end of December 1999). By February 2009 it was about 735.
So the same $100 bought roughly twice as much of the market in early 2009 as it did in early 2000. Every month that felt terrible was a month Epi’s money went further. The crash put the whole market on sale at about half price, and he was still buying.
Benji’s $100, meanwhile, was still just $100.
That’s why year 11 is where Epi passes Benji for good. Most of his final balance came late: at year 20 he had about $55,000, and the last six years roughly doubled it. Another bad year arrived in year 23 (it replays 2022). By then it barely registered.
And at the end, Benji’s account is below what he put in: $28,102 on $31,200. He never had a crash. Rising prices still quietly took $3,098 of buying power from him.
What happened when I did this with my own money
The video is a cartoon. This part isn’t.
I kept investing through a drop in my own account, and it was hard. Harder than the spreadsheet makes it sound. Looking at the balance every day was miserable, because every day it was a little lower than what I’d put in, and there’s nothing you can do about that except stop.
So I stopped looking. For a few years I honestly didn’t open my investment account. I kept myself busy with other things and let the automatic deposits keep going into the market every month without me deciding anything.
Looking back, that’s the only reason it worked. I didn’t out-think the market. I just took myself out of the moment where I’d have been tempted to pull the plug. Epi’s numbers above assume someone who keeps buying every single month, through year 9, without blinking. Real people blink. Not checking was how I got around that.
What if you panic-sell?
Say Epi had sold everything at the bottom in year 9, then came back four years later once things looked calm again. Same $100 a month the whole time.
He’d finish with about $84,600 instead of $111,900. That’s $27,264 less, for doing what felt sensible at the time.
Most of that cost comes from the four years on the sidelines, while the market climbed back without him. J.P. Morgan Asset Management’s 2026 retirement guide found that $10,000 in the S&P 500 from 2006 to 2025 grew to about $80,600, but missing just the 10 best days cut it to about $35,900. Six of those 10 best days came within two weeks of the 10 worst. The good days show up right next to the scary ones, which is exactly when people are sitting on the sidelines.
How much do fees cost on $100 a month?
More than you’d guess. A 1% yearly fee would have left Epi with about $95,400 instead of $111,900: $16,443 gone over 26 years.
The big S&P 500 index funds charge as little as 0.03% a year, which works out to $3 a year on every $10,000 (fees as listed by Forbes in October 2026). Some charge even less. The average index stock fund on offer charges about 0.45%, according to the Investment Company Institute. So if you already have an account, the fee line is worth a look. It’s usually called the “expense ratio.”
Was Epi just unlucky? Every start year since 1928
Fair question. One start year proves nothing.
Actually, Epi’s start was one of the worst. His first ten years rank among the six worst ten-year stretches since 1928 (the very worst was a 1965 start, which turned $12,000 into about $7,900 in today’s money). So I ran the same plan, $100 of today’s money each month, from every start year since 1928.
| Keep going for | Put in | Worst | Typical | Best | Start years that ended behind |
|---|---|---|---|---|---|
| 1 year | $1,200 | $928 | $1,275 | $1,551 | 31 of 98 (about 1 in 3) |
| 5 years | $6,000 | $3,969 | $7,304 | $11,676 | 17 of 94 (about 1 in 5) |
| 10 years | $12,000 | $7,885 | $18,484 | $32,854 | 11 of 89 (about 1 in 8) |
| 20 years | $24,000 | $22,787 | $53,219 | $125,407 | 3 of 79 |
| 30 years | $36,000 | $54,542 | $122,003 | $258,335 | 0 of 69 |
| 40 years | $48,000 | $156,707 | $246,559 | $441,778 | 0 of 59 |
The pattern is the whole story. Over one year, it’s close to a coin flip weighted in your favor. Over 20 years, only three start years ended behind (1955, 1959 and 1962), and each by about $1,200 or less. Over 30 years, none did.
So where does “half a million” come from?
From future dollars. A steady 10% a year turns $100 a month into about $559,000 after 40 years, and that’s roughly what the popular articles (Motley Fool’s among them) show. But those are dollars 40 years from now, and a dollar then won’t buy what it buys now.
In today’s money, no 40-year stretch since 1928 reached half a million. The best, starting in 1929, came to about $442,000. The typical one was about $247,000. That’s still a lot of money from $100 a month. It just isn’t the number on the thumbnail.
All of this already happened, and the next 26 years could go differently. History shows what the range has looked like, not what yours will be.
Is $100 a month even worth investing?
On these numbers, over a long stretch, yes: $48,000 put in over 40 years typically became about $247,000 in today’s money, and even the worst 40-year start ended above $156,000.
The catch is the word “long.” Which brings us back to Benji.
What Benji got right
After five years, about one start in five was still behind. So money you’ll need soon (a car, a deposit, the emergency fund) fits better in savings, the way Benji did it. A crash at the wrong moment can’t hurt money that isn’t in the market.
Money you won’t touch for twenty years is a different case. Since 1928, almost every twenty-year stretch came out ahead, for the people who kept buying when it looked worst.
If you’re just starting out with a small amount, my older post on how to start investing with just $50 covers the first steps. You can find more like this in Guides.
The one rule
Keep buying through the bad years.
That’s easy to type. It’s much harder in year 9 with your account down a third and someone at dinner telling you they told you so. Knowing which money is for the long run and which is for next year helps. Not staring at the balance every morning helped me more.
I’m building Epiphany Money, a personal finance app that shows all your accounts in one place and tells you in plain sentences what’s safe to spend and where your money is leaking. Join the waitlist if that sounds useful.
This post shows what happened in the past, not a promise of what will happen. It’s general education, not financial advice, and no fund is recommended.